by Conrad Meertins | Apr 22, 2024 | Valuation

In the ever-evolving world of real estate, “sharpening your saw”—a principle popularized by Stephen Covey in his seminal work “The 7 Habits of Highly Effective People”—isn’t just a recommendation, it’s essential.
This habit of self-renewal and continuous improvement is critical in Louisville, where market dynamics shift as quickly as the seasons. Mastering the subtleties of property valuation and market trends can catapult your results from mediocre to stellar.
Whether you’re a seasoned real estate professional or a first-time homeowner, the insights we share here will empower you to not just participate, but excel in the market.
With technological advancements and economic shifts transforming the landscape at breakneck speed, the need to continuously “sharpen your saw” in the realm of real estate has never been more critical.
Dive into this article to discover actionable tips and expert insights that will not only keep you competitive but also turn you into a market sage in Louisville’s vibrant real estate scene.
For Homeowners: Master Your Market for Better Outcomes

Imagine discovering that your home in Louisville could sell for 20% more than you expected. That’s not just good luck; it’s the power of understanding key real estate principles like market areas, comparable sales, and equity.
• Market Areas: Think of your market area in Kentucky as the neighborhood where you live, work, and play. It’s the circle around your home that includes the places you frequent. By understanding the dynamics of your market area, you can better gauge your home’s worth in relation to the local happenings.
• Comparable Sales (Comps): Comps are like your home’s competitors in the market race. They help set the stage for pricing your home accurately—ensuring you don’t overprice and linger on the market, or underprice and miss out on potential gains.
For instance, if homes with updated kitchens in your area are fetching a premium, that might inspire some strategic home improvements on your part.
• Equity: Knowing your home’s equity, which is the difference between its market value and any mortgage balance, could influence significant financial decisions. It’s especially useful if local property values in Louisville are rising, suggesting a good time to tap into that equity for home improvements.
Below is an engaging and educational quiz titled “How Well Do You Know Your Real Estate Terms?” aims to test the homeowner’s knowledge on critical real estate concepts.
For Agents: Elevate Your Services with Advanced Tools and Techniques

Being a real estate agent in Louisville’s market means staying ahead of the curve. It’s not just about selling homes; it’s about providing exceptional service that distinguishes you from the competition. Here’s how you can elevate your practice:
• Refined Comparative Market Analyses (CMAs): As an agent, your ability to conduct precise and insightful CMAs is crucial. This isn’t just about gathering data; it’s about deeply analyzing it to understand subtle market shifts and nuances.
By continuously refining your approach to CMAs, you ensure that your valuations reflect the most current market conditions in Louisville, giving your clients confidence in your pricing strategies.
• Adherence to Standards: Ensuring property measurements comply with the American National Standards Institute (ANSI) standards is not just about accuracy; it’s about trust. When clients know they can rely on your measurements, you build a foundation of credibility that is invaluable in this industry.
Enhancing Data Analysis to Serve You Better

As a real estate appraiser, to further support both homeowners and agents, I’ve advanced my expertise in data analysis through the use of R programming.
This powerful statistical tool allows me to handle, analyze, and visualize extensive datasets with precision—unveiling trends and patterns that inform more accurate market analyses and home appraisals.
Whether you’re determining the most accurate listing price or strategizing on property investments, my enhanced analytical capabilities ensure you receive the most reliable insights. This commitment to leveraging cutting-edge technology in data analysis underpins the superior service I strive to provide all my clients.
Embracing AI to Revolutionize Real Estate Transactions

The integration of AI tools into real estate is transforming the buying and selling experience for homeowners in Louisville.
By providing tailored insights and making processes smoother and more transparent, AI technologies help homeowners make informed decisions with increased confidence.
This advancement in technology ensures that each step of the real estate transaction is optimized for efficiency and clarity.
For agents, learning to utilize these advanced technologies can significantly boost your ability to manage more clients and properties simultaneously without compromising on the quality of service.
AI enables you to deliver more accurate property valuations, proactively anticipate market trends, and provide customized advice. This positions you as tech-forward professionals in a digital-first market.
The adoption of AI in real estate transcends mere technological advancement—it’s about embracing a new standard of excellence and sparking innovation across the industry. This shift not only enhances how you operate but also elevates the overall client experience, making it more efficient and informed.
Continuously Sharpen Your Saw
This post marks the conclusion of our series where we’ve applied Stephen Covey’s seminal work, “7 Habits of Highly Effective People,” to the real estate industry, specifically focusing on how these principles can transform your practice in Louisville.
It’s the continuous pursuit of knowledge and skill enhancement that sets the true leaders apart from the crowd. Whether it involves deepening your understanding of the market, embracing cutting-edge technologies, or refining your data analysis skills, each step you take is crucial.
These advancements are not just about keeping up—they’re about setting new benchmarks in service and expertise. I’d like to extend a heartfelt thank you for joining me on this insightful journey.
Let’s continue to engage with these innovative tools and concepts, commit to our professional growth, and confidently prepare to meet the future challenges of real estate head-on. Together, we will not only adapt but excel in this ever-evolving industry.
by Conrad Meertins | Feb 27, 2024 | Market Trends, Valuation

In the realm of real estate, the synergy between homeowners, realtors, and appraisers is not just beneficial; it’s essential.
Drawing from Stephen Covey’s 6th habit, “Synergize”, we see the immense value in collaborative efforts, especially when it comes to the precise task of home valuation. This principle underscores the strength found in teaming up, highlighting how collective inputs lead to superior outcomes.
The Unique Roles in Real Estate Transactions

Realtors are the navigators of the real estate transaction process, masters at brokering deals to ensure fairness and optimal outcomes for their clients. With an in-depth knowledge of market areas honed over years, they are pivotal in guiding homeowners through the complexities of selling or buying a home.

Appraisers, on the other hand, bring a different set of skills to the table. As valuation experts, they delve into the nitty-gritty details of property value, armed with data and trends to pinpoint the most accurate market value.
Their expertise becomes particularly crucial in fluctuating markets, where accurate valuations can make or break a deal.
The Synergy in Action: A Real-World Scenario
Consider a homeowner eager to sell their property. They believe their home is worth $350,000, while their realtor, considering current market dynamics, suggests a starting point of $300,000.
Here, the realtor could either acquiesce to the homeowner’s wishes or provide detailed market insights to align expectations. This is where an appraiser’s expertise becomes invaluable.
Data and Evidence: Understanding Louisville’s Market
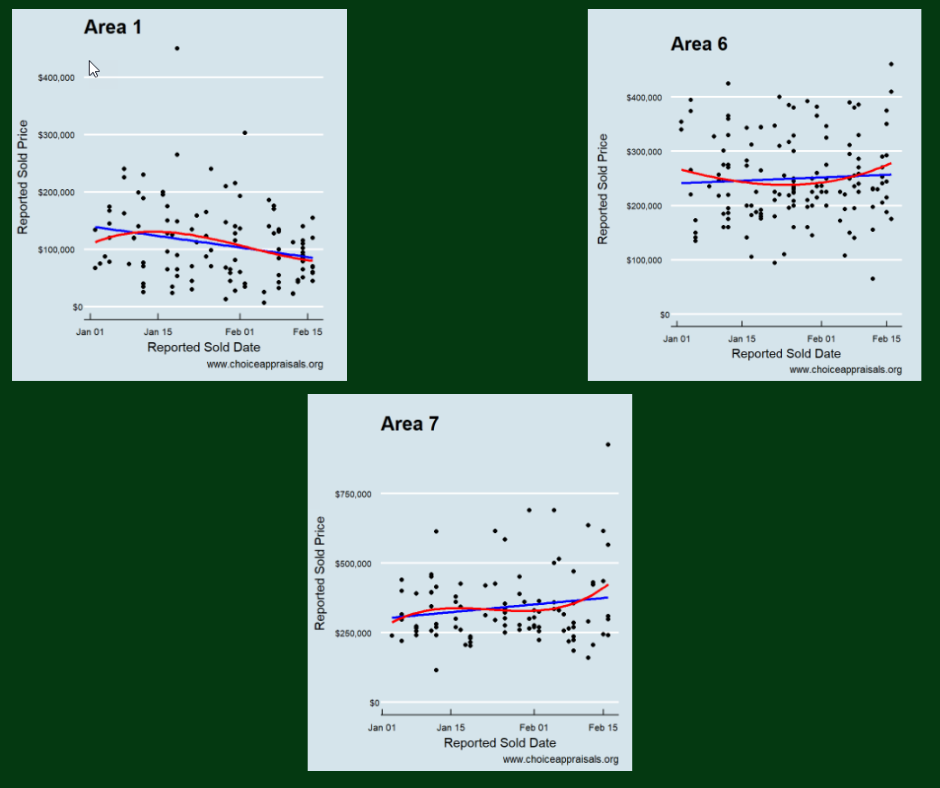
The above graph highlights the trend for homes that sold in MLS Area 1, Area 6, and Area 7. While Area 1 experienced a decline in sales prices with 114 sales, Areas 6 and 7 showed an uptick, boasting 145 and 96 sales, respectively.
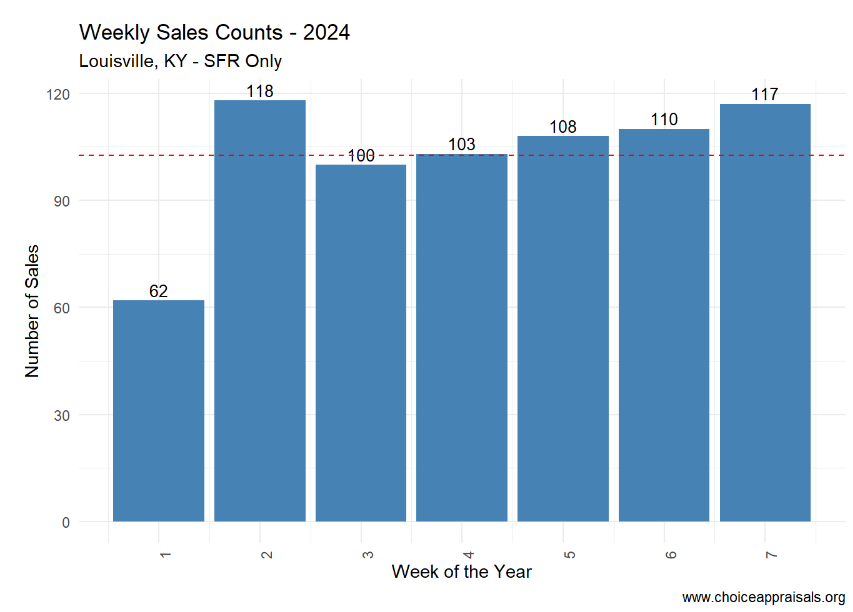
The above graph highlights the weekly volume of sales in Louisville, KY. since week one of 2024
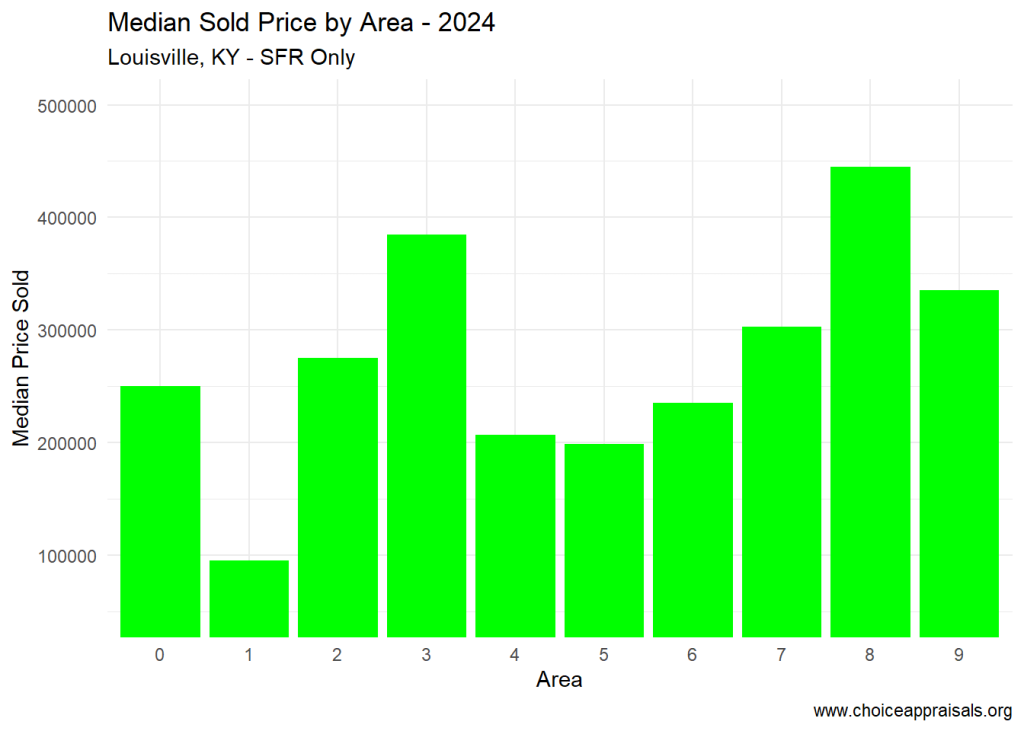
The above graph illustrates the median sale price for each MLS area in Louisville, KY over the first 7 weeks of 2024. As can be seen from the above charts, in week 7 of 2024, Louisville’s real estate market presented varied trends across its MLS areas.
The average days on market hovered between 20 and 25, with an overall median sales price of $249,000 across Louisville.
However, disparities exist, with Area 3 approaching a median of $400K and Area 8 nearing $450K. Such granular data is crucial for appraisers and realtors alike to provide homeowners with accurate, realistic valuations.
Leveraging Synergy for Success

When realtors and appraisers collaborate, sharing insights and data, they ensure homeowners receive the most accurate valuation, tailored to the nuanced dynamics of their specific MLS area.
This synergy not only enhances trust among all parties but also secures a smoother transaction process, grounded in realism and mutual understanding.
Embrace Collaboration

For homeowners, understanding the value of your home is more nuanced than it might appear. Engage both your realtor and a local Louisville appraiser in the conversation.
Realtors, don’t hesitate to bolster your market knowledge with insights from appraisers. Appraisers, your expertise is more critical than ever in today’s data-rich age—collaborate with realtors to demystify market trends for homeowners.
The Winning Formula
Synergy, as Stephen Covey highlighted, is about producing a collective outcome that surpasses what individuals could achieve alone.
In Louisville’s diverse real estate landscape, embracing this collaborative spirit ensures that homeowners, realtors, and appraisers alike can navigate the valuation process with confidence, accuracy, and success.
Let’s work together, leveraging our unique strengths for the common goal of transparent, fair, and effective real estate transactions. Go Louisville, where synergy is indeed where it’s at!
by Conrad Meertins | Feb 14, 2024 | Uncategorized

Unlocking the Power of Data in Real Estate
In the competitive world of real estate, the savvy individual knows that success is not just about what you say, but how deeply you understand the market before you speak. Stephen Covey’s fifth principle, “Seek first to understand, then to be understood,” rings especially true in this context. For Louisville homeowners and real estate agents alike, a profound comprehension of local market trends is not a mere advantage—it is an absolute necessity. This article is your lens into the Louisville market, providing the clarity needed to harness its full potential.
The Heartbeat of the Market: Weekly Sales Counts
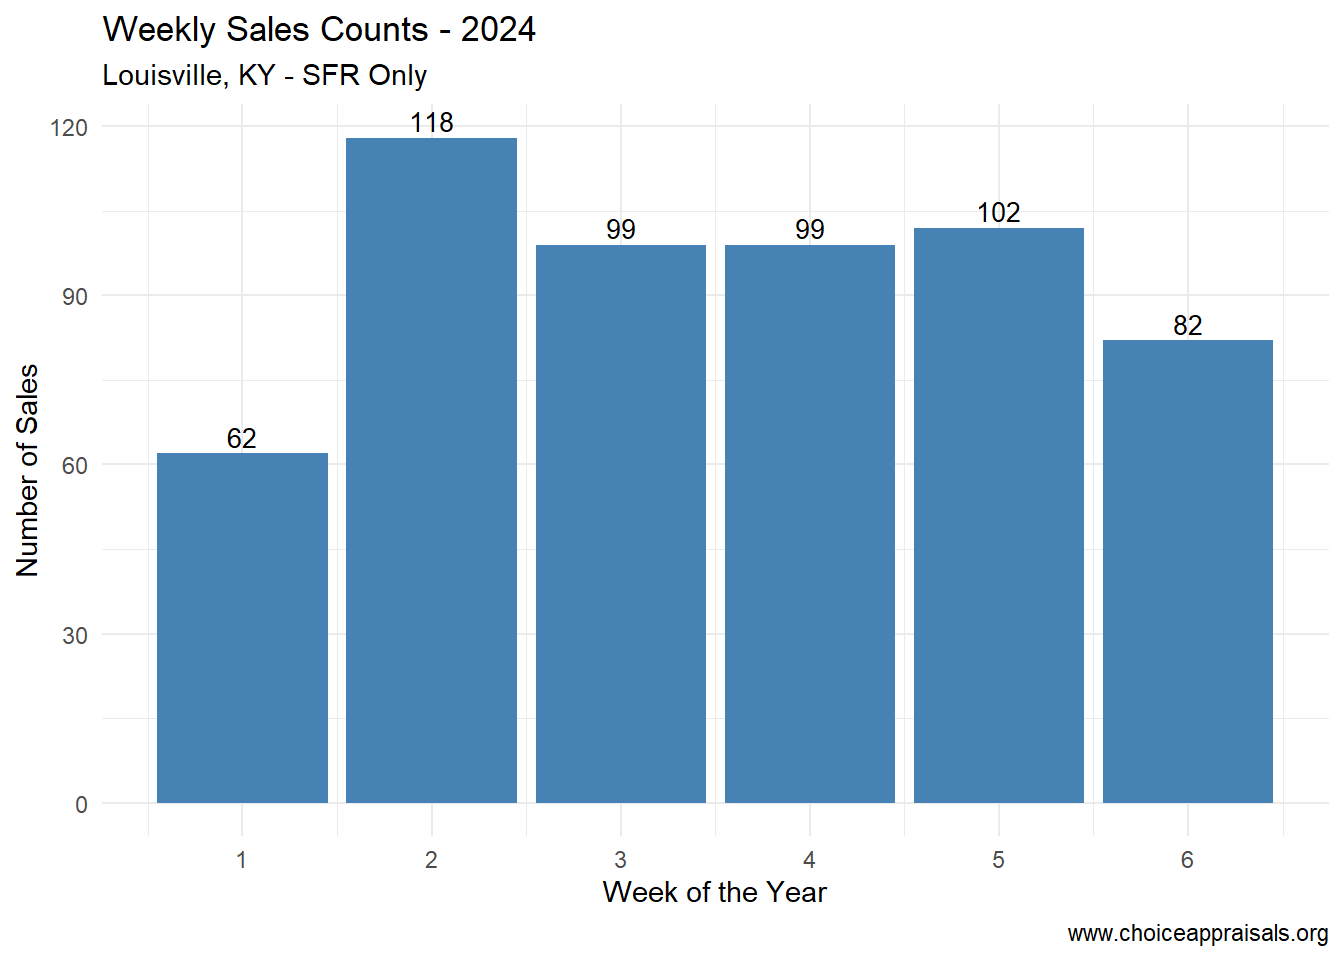
Ups and Downs
The weekly pulse of Louisville’s real estate market beats clearly through the data provided by the MLS. Observing the initial six weeks of 2024, we witness a fluctuating pattern of sales, with peaks that speak to healthy buyer interest and dips that suggest market hesitations. Understanding this rhythm is crucial for anyone looking to enter the market, be it for listing a home or preparing for an appraisal. The key is not just to observe but to act on these insights and to let them help to manage your expectations.
Price Point Precision: Navigating the Sold Price Distribution
Finding the Sweet Spot
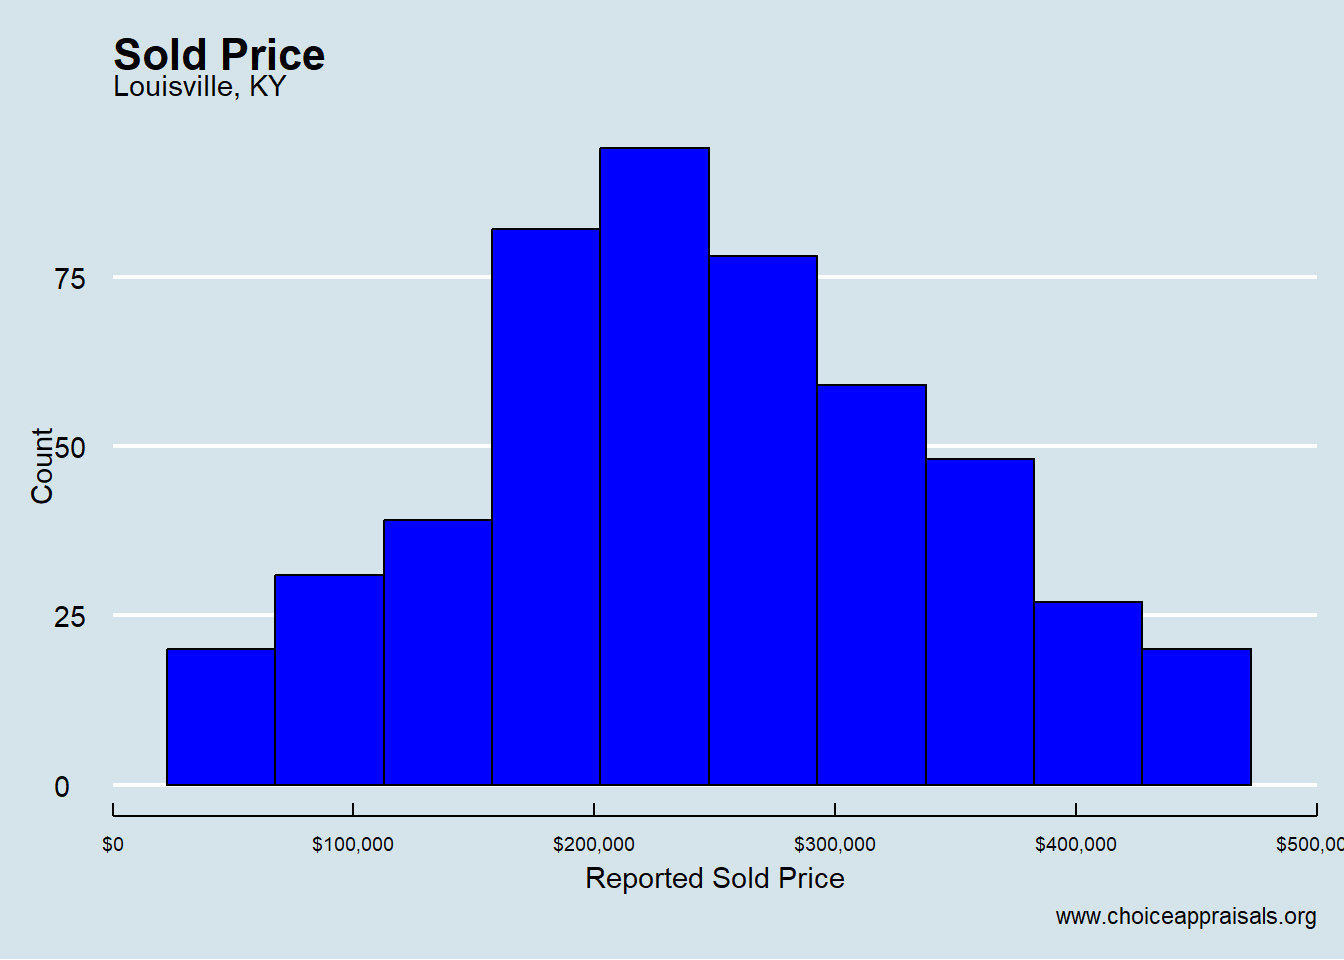
The distribution of sold prices in Louisville (for 1/1/24 – 2/11/24) reveals where the action truly is. Most homes changing hands fall within the $200,000 to $300,000 range, providing a clear target zone for sellers aiming to price their homes competitively. But the market is not one-size-fits-all. Neighborhood-specific trends could shift your home’s position on this spectrum, highlighting the importance of tailoring your strategy to the nuances of your locale.
The Timing of the Sale: Days on Market Analysis
Median vs. Average: A More Accurate Market Tempo
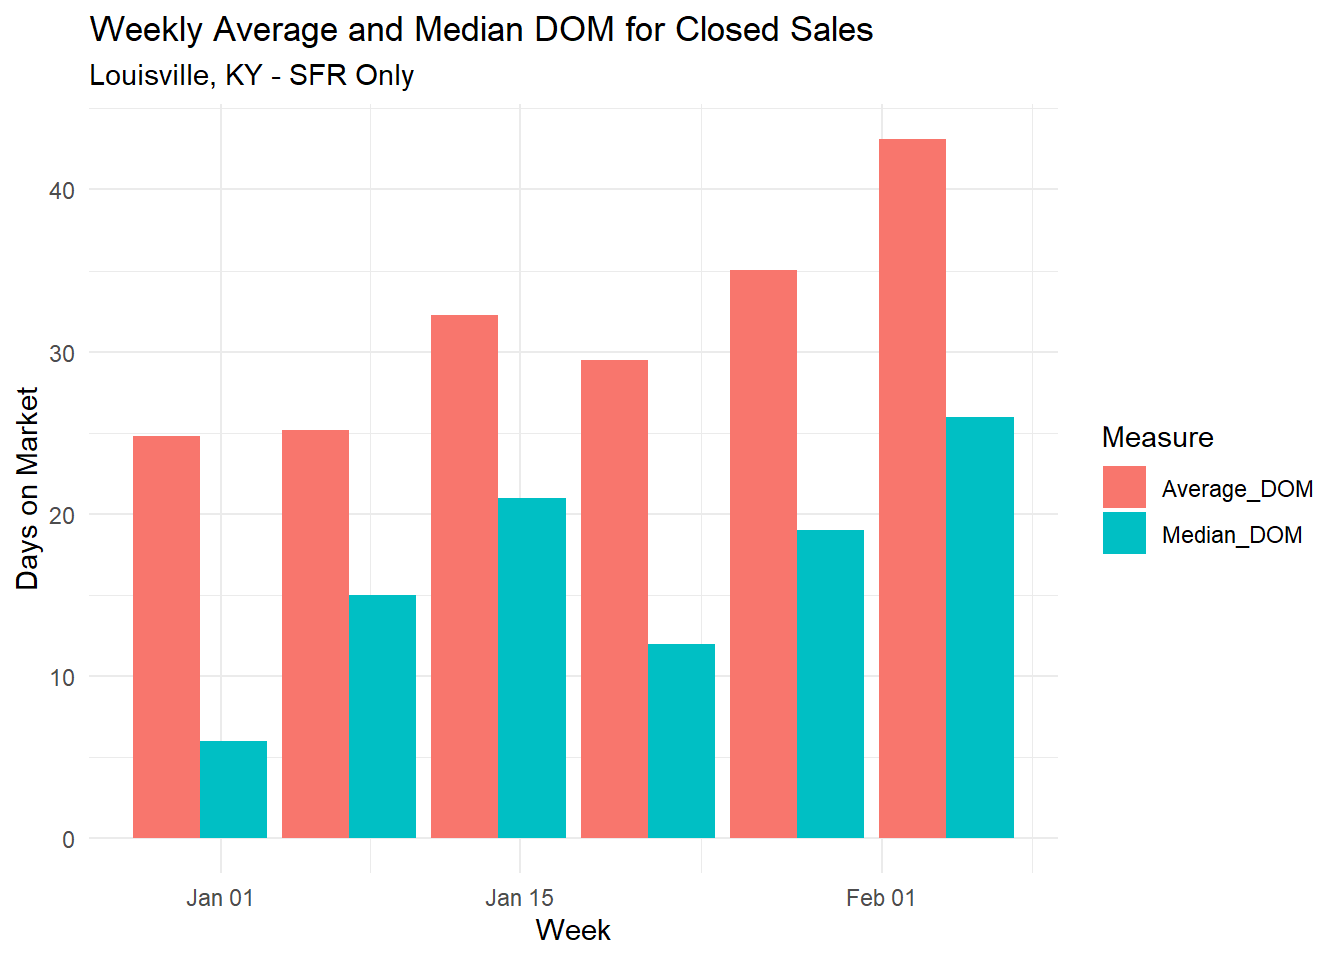
The Days on Market (DOM) chart is a crucial indicator of how swiftly homes are moving in Louisville. Unlike the average DOM, which can be distorted by outliers, the median DOM offers a more faithful representation of what sellers can expect. This distinction is pivotal, as it can shape both the pricing strategy and the marketing approach for your home listing.
Understanding the complex layers of the market goes beyond the surface numbers. By dissecting data, real estate professionals can detect micro-trends that influence broader market movements. For example, a sudden increase in the DOM may indicate a shift towards a buyer’s market, necessitating a more aggressive marketing approach or a reassessment of pricing strategies.
The Art of Negotiation
A deep understanding of market data not only empowers realtors to provide exceptional service but also equips homeowners to engage in informed negotiations. Knowledge of the median sold prices and DOM empowers homeowner to enter negotiations with realistic expectations and the confidence to make or accept offers that are in line with market dynamics.
Real-Life Success Stories: Data-Driven Decisions in Action
When appraising a home in Louisville, a family learned firsthand the power of market knowledge. They needed to sell their mother’s home and got a low offer. With my help, they saw that homes in her area were selling fast, often in less than a month. So, they didn’t have to take the first offer that came along. By setting a competitive price that matched what other homes were selling for, they were in a strong position to sell quickly and for a better price. This real-world example shows why it’s smart to understand the local real estate scene before setting a price or accepting an offer.
Adapting to Market Shifts: Staying Ahead of the Curve
The ability to adapt to market shifts is what sets apart successful real estate professionals and savvy homeowners. Regular analysis of sales counts, price distributions, and DOM trends helps anticipate market changes, allowing for proactive rather than reactive strategies.
In wrapping up our comprehensive analysis of Louisville’s real estate market, we’ve uncovered the profound impact of data on every facet of real estate transactions. By adhering to Stephen Covey’s timeless principle and applying it to the interpretation of market data, we’ve demonstrated how it can lead to more strategic and successful real estate decisions. From the valuation of a property to the intricacies of listing and negotiating, a data-driven, seek first to understand approach is not just advantageous—it’s indispensable. The market speaks a language of numbers and trends; fluency in this language is what leads to confident, informed, and successful outcomes.
by Conrad Meertins | Jan 30, 2024 | Market Trends

In the heart of Louisville, real estate embodies a simple truth: everyone can indeed win. As an appraiser and an optimist who always looks for the silver lining, I see the essence of ‘Win-Win’ deeply ingrained in the process of buying and selling properties.
Just think of the definition of market value—a probable price struck when buyers and sellers, each acting in their own best interest without pressure, reach a harmonious agreement. This is the epitome of ‘Win-Win’ in our world.
But let’s get practical—how does this philosophy translate into the nuts and bolts of property valuation and deciding how to list your home?
It all begins with facts. A quote that I love is as follows: True victory is not in the acquisition alone but in the integrity of the transaction. Misrepresentation benefits no one.
That’s why due diligence is a cornerstone. And for us real estate professionals, our role is crucial—we must anchor our valuations in reality, not fancy. In this context, thinking ‘Win-Win’ is built on understanding the facts of our current real estate landscape in Louisville.
Let’s lay out these facts, not with complexity but with the clarity that empowers. With a clear view of how the market has fared in the first month of 2024, we pave the way for decisions that benefit all.
Active Listings: Climbing Towards More Opportunities
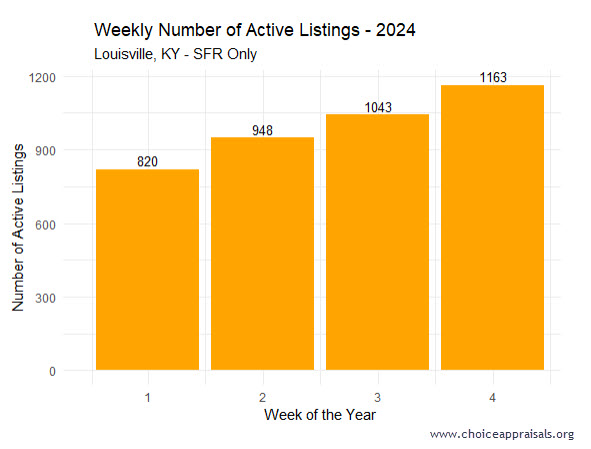
The bar graph illustrates an upward trend in the number of active listings from 820 in the first week to 1163 by the fourth week.
A growing inventory could be indicative of two trends: either sellers are entering the market to take advantage of favorable conditions, or it could suggest a slowdown where listings are staying on the market longer than in previous periods.
It’s important for agents and homeowners to watch this trend closely, as a high inventory level could lead to a more competitive market for sellers, possibly affecting prices and selling strategies.
Cumulative Sales: Assessing the Market’s Lift-Off
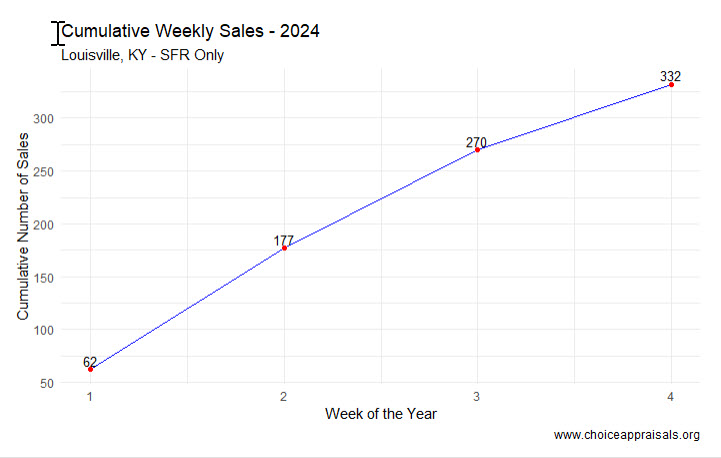
The “Cumulative Weekly Sales – 2024” graph for Louisville, KY, depicts an upward trend in property sales over the first month, with sales rising from 62 to 332. While at first glance this seems to indicate a thriving market, we have to be careful.
The trend does not necessarily signify robust growth without a benchmark. Seasonal influences also play a crucial role in real estate activity. So, it’s important to question whether this early-year sales uptick means.
Time will tell but for the sake of home buyers, realtors and appraisers, we hope it’s a sign of greater sales volume than last year.
In this context, a Win-Win scenario materializes when everyone leverages this data coupled with the information about active listings to make decisions that reflect both the present moment and the potential of the market’s future.
MLS Areas: Decoding the Sales Price Variance
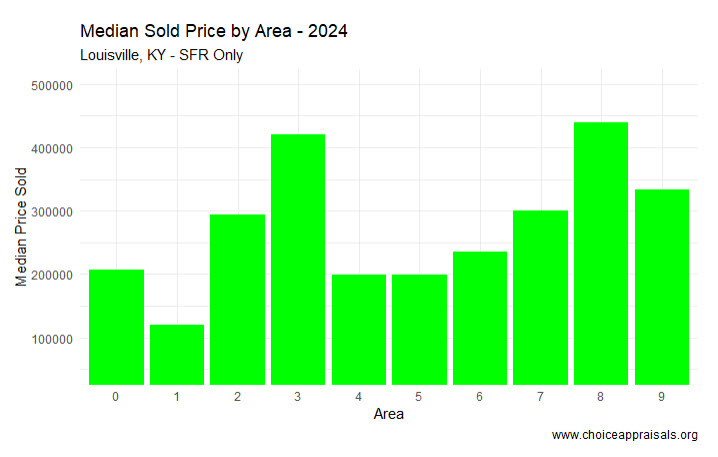
The graph showcasing the “Median Sold Price by Area – 2024” in Louisville, KY, for single-family residences reveals varied median prices across nine different areas.
This variance highlights the diverse nature of the housing market within the city, suggesting that certain areas are more in demand or possess attributes that command higher prices—factors such as school districts, proximity to amenities, and neighborhood desirability might be influencing these figures.
Notably, Area 8 stands out with a median price significantly higher than the others, which could indicate a premium neighborhood or area with larger or more luxurious homes. Conversely, Areas 1 exhibits a notably lower median sold price, which could reflect a variety of factors such as older homes, or more modest housing options.
Interesting Fact: Area 1 had the second highest amount of sales volume for the first four weeks of January 2024 with 47 sales. I personally have done more Louisville appraisals in this part of town in the past 30 days. Area 8 came in at #5 with 35 sales. It’s funny how the winner changes when we change the lens that we look through.
Weekly Sales: Unpacking the Market’s Pulse
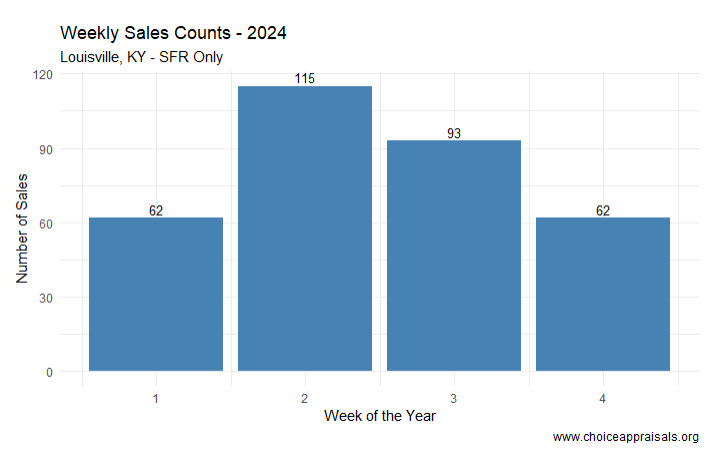
The “Weekly Sales Counts – 2024” graph for Louisville, KY, presents a roller coaster like sales pattern within the first month of the year. We begin with 62 sales in week one, surge to 115 sales in the second week, then experience a decrease to 93 in week three, before returning to the starting point of 62 sales in week four.
This ebb and flow could reflect a number of underlying market dynamics. The initial rise in sales might indicate a wave of activity often seen at the beginning of a new year, as buyers and sellers enter the market with fresh goals.
Then, week three seems to whisper, “Let’s just slow down and think about this,” possibly due to buyer hesitancy or sellers holding out for better offers. By week four, we’re back to where we started, which could be a sign of market stabilization—or maybe it’s just taking a nap after the excitement of the year end – I think/hope it’s the latter!
The subsequent fall could suggest that this initial enthusiasm is tempered by external factors, such as economic news or interest rate adjustments, which may cause market participants to act more cautiously.
Overall, this data underscores the importance of monitoring weekly market movements closely, as they can provide early indications of shifts in buyer and seller behavior that could impact strategy and decision-making.
Valuations: Crafting a Win-Win Strategy
When it comes to valuations, ‘Think Win-Win’ is about fairness and balance. For realtors and clients in Louisville, here’s how you can put this into practice:
Stay Informed and Educate: The real estate market is dynamic, and being well-informed is key. An educated homeowner is more likely to price their home accurately, and an educated buyer can make a fair offer.
Regular Market Analysis: Keep an eye on how homes are priced in different areas. Realtors should provide homeowners with a regular analysis of how the market is moving, not just in terms of price but also in how long homes stay on the market.
Set Realistic Expectations: Help clients set realistic expectations based on market data. If the market is indicating a decrease in demand, homeowners should be prepared for potentially longer selling times.
Listen and Adapt: A Win-Win situation comes from understanding what the other party values. Listen to buyers and sellers carefully and adapt your strategy to align with their goals.
Prepare for Different Scenarios: The market can shift unexpectedly. Have a plan for different scenarios, whether it’s a sudden uptick in interest rates or a change in buyer sentiment.
Conclusion
In the Louisville market, adopting a ‘Think Win-Win’ approach in real estate isn’t just idealistic, it’s practical. It’s about creating transactions where buyers and sellers walk away satisfied, where the value is fair, and where the community thrives on the integrity of its dealings.
I invite you to reflect on this philosophy and how it has shaped your experiences in real estate. Have you encountered situations where the Win-Win approach turned a negotiation around or created a surprising opportunity? Share your stories and insights. Let’s continue the conversation and learn from each other, so we can all reap the rewards of a market that works for everyone.
by Conrad Meertins | Jan 21, 2024 | Valuation

Are you striving to master the art of perfecting listing prices in today’s dynamic real estate market?
Understanding the home appraisal process in Louisville, KY is a crucial step in this journey. Imagine being the realtor or homeowner who always knows the property’s true worth, navigating the valuation landscape with ease.
It’s not just about the numbers; it’s about interpreting them in the context of a constantly evolving market.
This blog delves into the subtleties of real estate valuation, examining the critical aspects that influence it, from an appraiser’s local market knowledge to the unique features of properties, and adapting to rapid market changes.
By aligning these insights with Stephen Covey’s “First Things First” principle, my goal is to help you to navigate these complexities effectively, ensuring more informed decision-making and successful client outcomes.
Common Valuation Challenges

A critical aspect often encountered in real estate transactions in Louisville, and in most areas, is the difference between the appraised value and market value of properties.
This difference, even as appraisers strive to provide the current market value, can largely be attributed to the appraiser’s expertise and understanding of the local market.
Appraiser’s Expertise and Local Market Knowledge
Appraisers strive to estimate a property’s value based on a set of standardized criteria, including the analysis of comparable sales, property condition, and market trends.
However, the depth of an appraiser’s local market knowledge can significantly influence the accuracy of the appraisal. A home appraiser with extensive experience and familiarity with a specific area of Louisville is more likely to provide a valuation that closely reflects the current market conditions.
They can better understand and interpret nuances like local demand trends, and even subtle influences like school districts or future development plans.
In contrast, an appraiser who may not be as deeply versed in the specifics of a locale might miss these subtleties. This gap in local insight can lead to variances between the appraised value and the market value as perceived by buyers and sellers in that specific market.
Navigating the Valuation Landscape
For realtors, understanding this aspect is crucial. Recognizing the importance of an appraiser’s local expertise can help in setting realistic expectations for both buyers and sellers.
It also underscores the value of engaging appraisers who are well acquainted with the property’s area, ensuring a more accurate reflection of the current market value.
Encourage your sellers to ask questions that will indicate that the appraiser knows the area. What if his answers sound fishy? Request another appraiser from the bank.
In line with Stephen Covey’s “First Things First” principle, prioritizing this understanding can greatly aid in navigating the valuation landscape, allowing for more informed decision-making and effective client guidance in real estate transactions.
Recognizing and Communicating Unique Property Features

In the context of home appraisals, understanding how unique property features are evaluated is another crucial part of the valuation puzzle. This knowledge is especially significant when bridging the gap between an appraiser’s valuation and a buyer’s perception of value.
How Appraisers View Unique Property Features
Appraisers approach property evaluation methodically, assessing a spectrum of features from basic structural elements to unique attributes.
These unique features might include custom interior designs, recent renovations, or exceptional architectural styles. Each of these is scrutinized for its impact on the property’s overall value.
However, the value that appraisers assign to these features might not always align with a potential buyer’s perceived value.
A feature that significantly enhances the aesthetic or functional appeal of a property, like a professionally landscaped garden, may be highly attractive to certain buyers.
Yet, in terms of appraised value, this feature might not lead to a proportional increase. This discrepancy arises because while appraisers acknowledge these features, their assessment is grounded in quantifiable impact more than subjective appeal.
The Realtor’s Role in Highlighting Unique Features
For realtors, this underscores the importance of effectively recognizing and communicating these features during transactions. Understanding the appraiser’s perspective on unique property features allows realtors to better manage client expectations regarding valuation.
Moreover, it empowers realtors to highlight these features in ways that resonate with potential buyers, showcasing the added value these unique aspects bring to the property.
By aligning appraisal insights with strategic communication, realtors can navigate the valuation landscape more effectively, ensuring a smoother transaction process and potentially enhancing property appeal in the competitive real estate market.
Adapting to Market Changes and Informing Appraisers

Understanding the appraisal of unique property features is just one facet; equally important is adapting to and proactively addressing rapid market changes. These fluctuations can significantly influence property valuations, and understanding how to communicate these shifts to appraisers is critical.
The Impact of Rapid Market Changes on Valuations
The real estate market in Louisville, KY and across the country is inherently dynamic, often influenced by factors like economic shifts, interest rates, and local developments.
These changes can swiftly alter property values, sometimes quicker than can be reflected in an appraisal based on historical data. For instance, a sudden surge in demand in a particular area might significantly increase property values, a change that recent sales data may not fully capture.
Proactive Communication with Appraisers
In these scenarios, the role of a realtor extends beyond just understanding market dynamics. It involves actively communicating these shifts to appraisers early in the valuation process.
While appraisers are experts in their field, they might not always be immediately aware of very recent market changes. By providing appraisers with the latest market insights, realtors can ensure that these factors are considered in the home appraisal analysis.
This proactive approach aligns with Stephen Covey’s “First Things First” strategy. Prioritizing the sharing of up-to-date market information with appraisers helps ensure that the valuation accurately reflects current market conditions.
This not only aids in creating more accurate appraisals but also helps in setting realistic expectations for both buyers and sellers.
Staying Informed and Adaptable
For realtors, staying informed about the latest market trends and developments is imperative. This means regularly reviewing market reports, engaging with local real estate networks, and maintaining a pulse on any sudden changes.
By being well-informed and adaptable, realtors can effectively guide their clients through the complexities of real estate transactions in a rapidly changing market.
Mastering the Art of Real Estate Valuation

The journey through the landscape of real estate valuation is both challenging and rewarding.
Understanding the depth of an appraiser’s local market knowledge, recognizing the impact of unique property features, and staying agile in the face of market dynamics are not just tasks – they are essential skills for today’s realtors.
By proactively communicating with appraisers, aligning with the latest market trends, and effectively highlighting the unique aspects of properties, realtors can significantly enhance their service to clients.
This approach, rooted in the wisdom of “First Things First,” is not just about adapting strategies; it’s about foreseeing opportunities and navigating the real estate market with confidence and expertise.
As we embrace these principles, we not only succeed in individual transactions but also contribute to the broader narrative of real estate professionalism and homeowner satisfaction.
by Conrad Meertins | Jan 15, 2024 | Market Trends

Imagine uncovering a secret blueprint that could transform your approach to real estate. This blueprint merges Stephen Covey’s timeless wisdom from “Seven Habits of Highly Effective People” with the dynamic realm of real estate transactions. The focus here is on the second habit, “Begin with the End in Mind,” a principle I believe is key to navigating the ever-evolving real estate market.
In the following sections, we’ll explore recent Louisville, KY real estate trends and uncover often-overlooked insights.
As we do, we can apply the ‘Begin With the End in Mind’ approach to our 2024 Real Estate Strategy. This isn’t just about goal setting—it’s about using market analytics to guide our decisions in real estate.
Let’s dive into how this forward-thinking principle can sharpen our competitive edge.
Q1 Insights: Setting the Stage for Annual Market Trends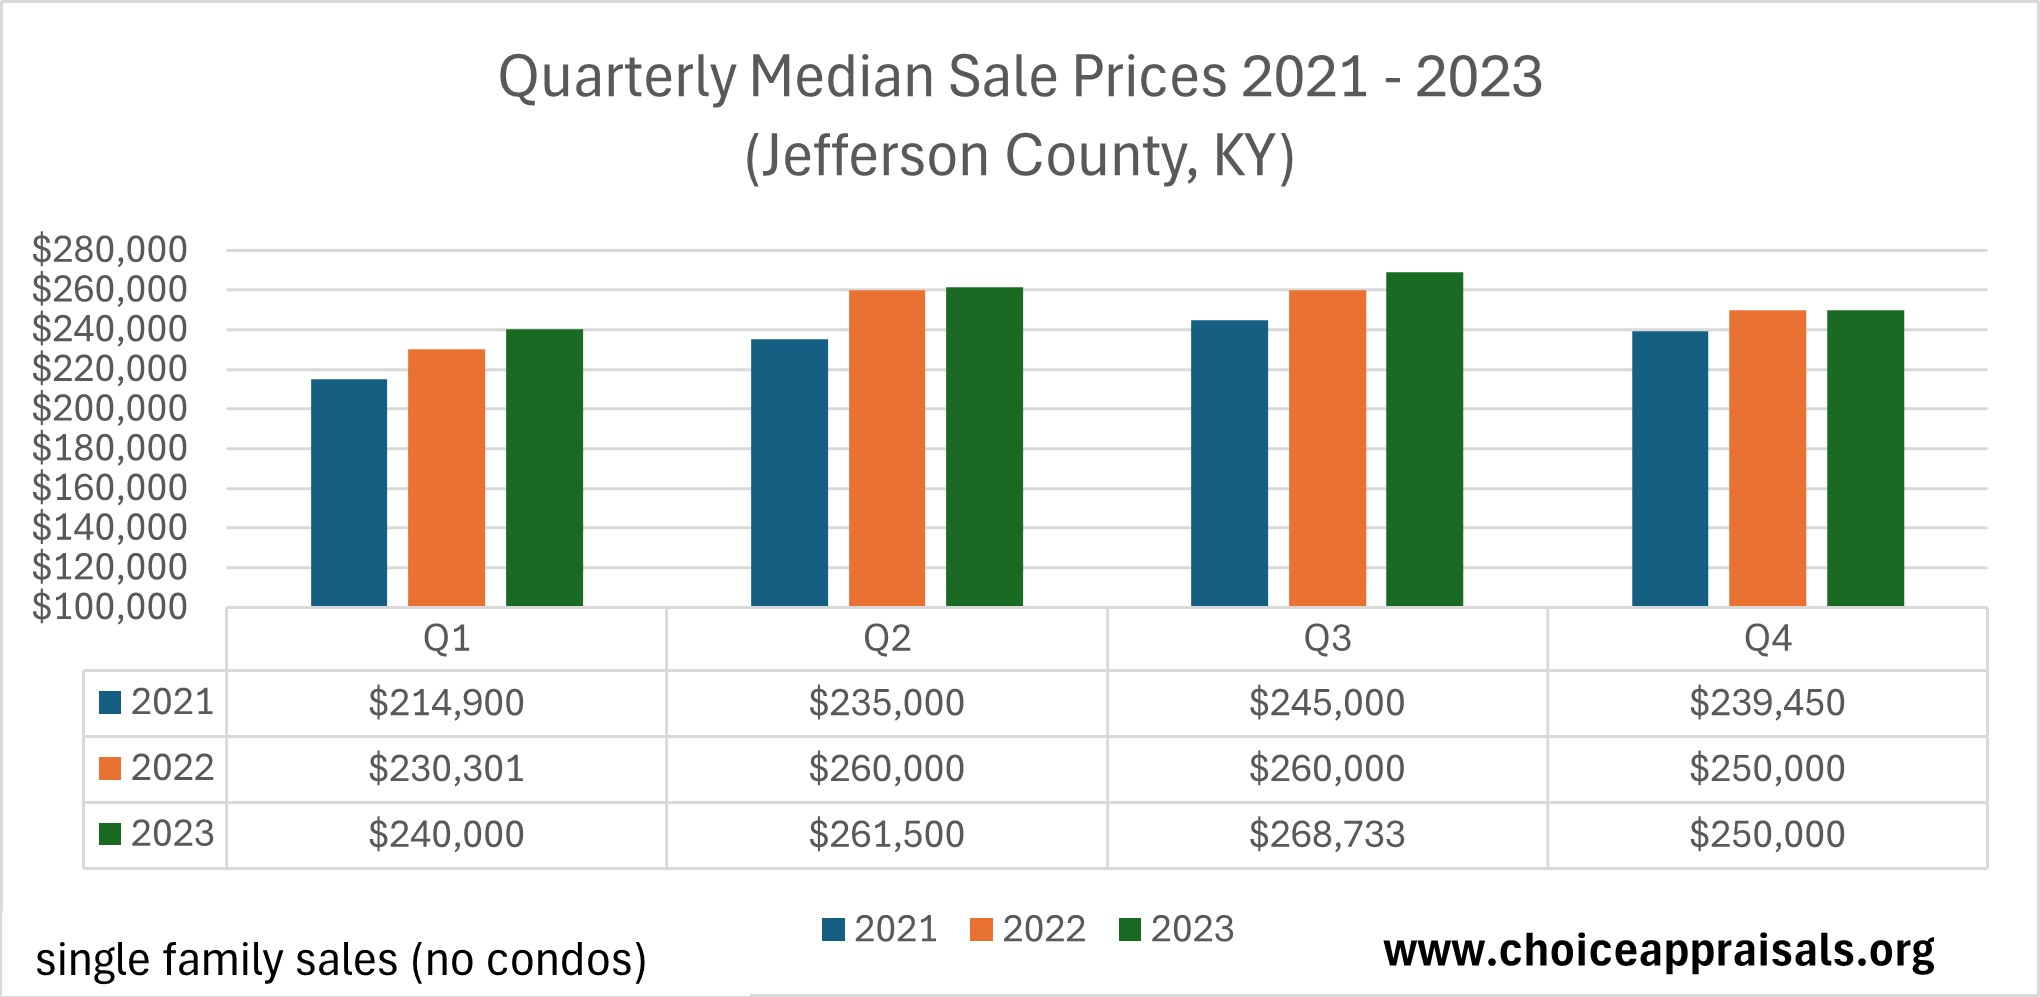
Let’s examine the market trends reflected in the quarterly median sale prices from 2021 to 2023 in Louisville, KY. Despite a reduction in the number of homes sold, which isn’t shown on this graph, there’s a clear upward trend in the prices that buyers have been willing to pay.
Starting each year with a glance at Q1, we can observe that 2023 opened with home prices that were higher than at the beginning of 2022, which also had surpassed 2021’s figures. This consistent rise in initial prices year over year is a positive indicator of growing market strength.
However, looking at the year’s end, we notice a slight deviation from this trend. While the closing prices of 2022 improved upon 2021, the same cannot be said for the transition from 2022 to 2023.
Although the prices didn’t climb higher at the end of 2023, they didn’t fall either, maintaining the gains from earlier in the year. This stability, rather than a decline, suggests that the market is holding its value well, which is reassuring for both current and prospective homeowners.
The Closing Quarter: Reflecting on Market Resilience
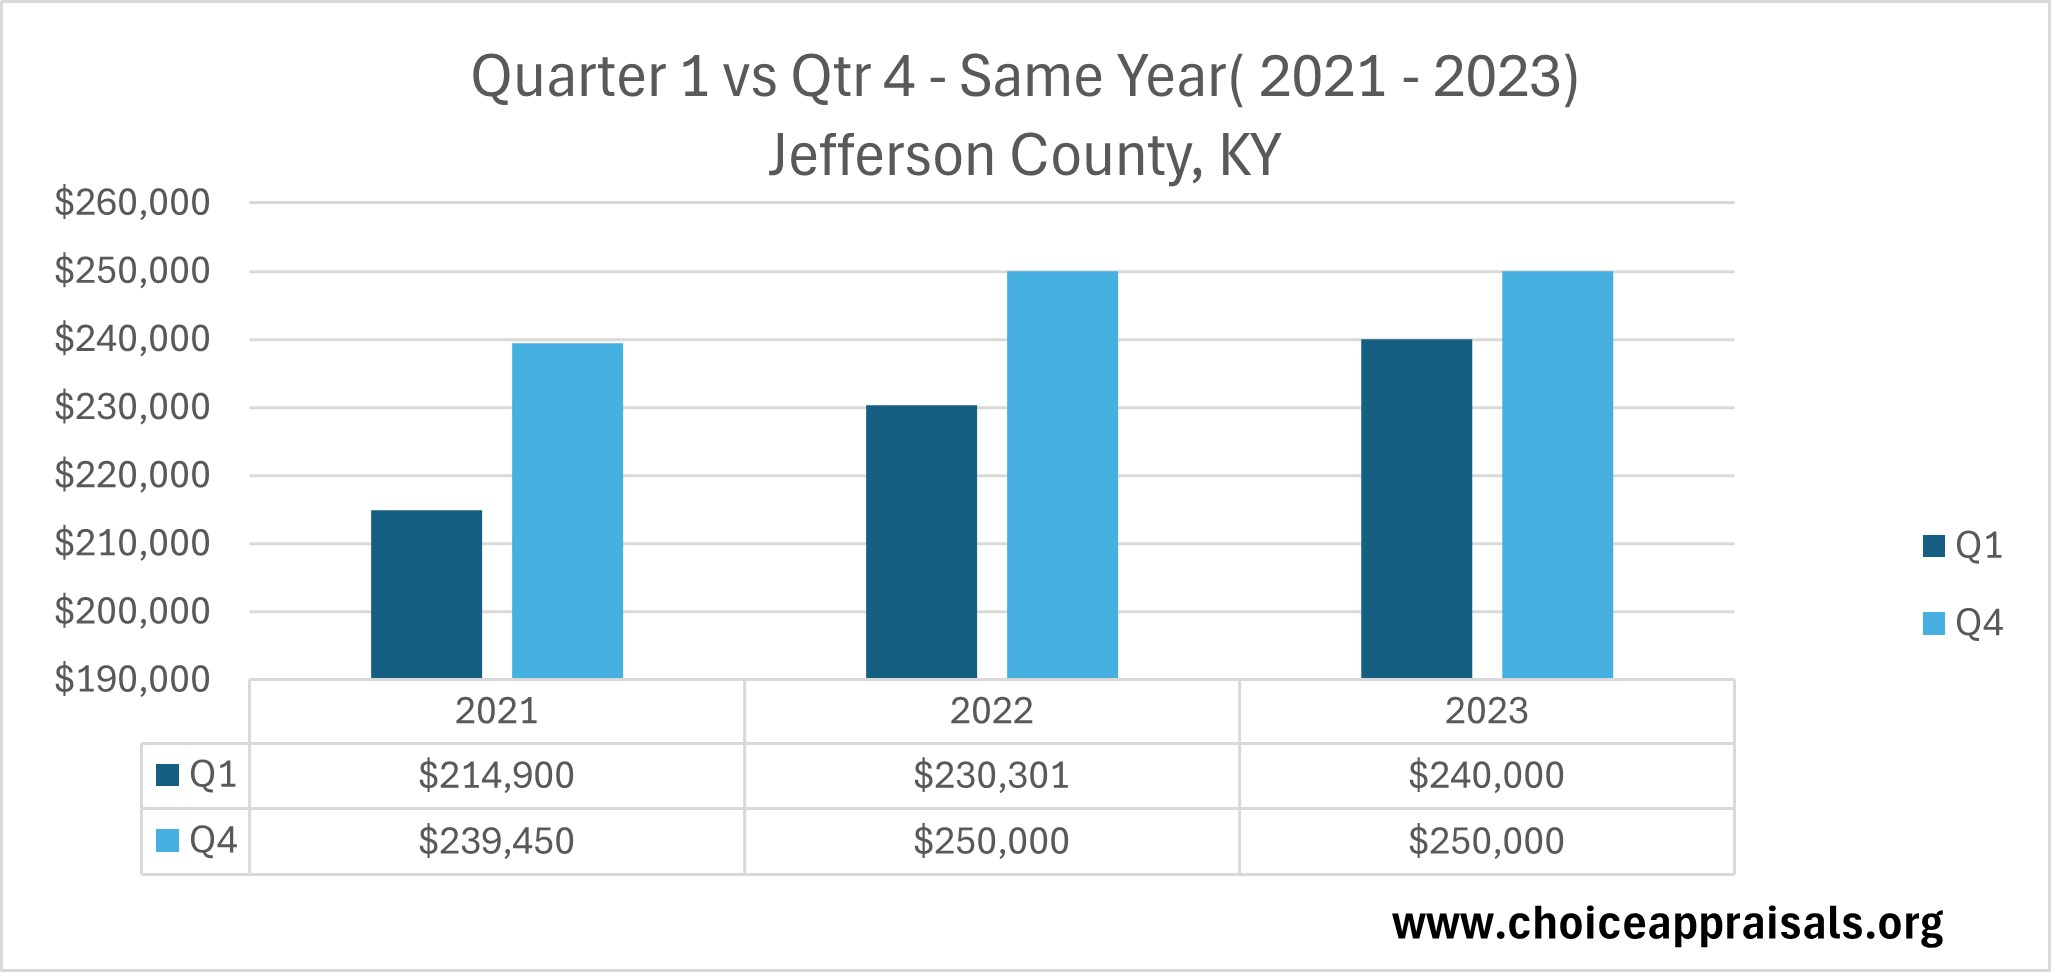
Consistency is key in the real estate market, and the trends in Jefferson County, KY, reaffirm this saying. If we take a closer look at how property prices have behaved at the start and end of each year from 2021 to 2023, we find an encouraging pattern.
Despite the expected seasonal dip towards the end of the year, the big picture is one of growth. Specifically, the comparison between Q1 and Q4 within the same year shows us that regardless of the short-term fluctuations, the overall value of homes has been on an upward trajectory.
For instance, in Louisville, KY as a whole, the opening quarter’s median sale prices have consistently been lower than those at the year’s close. This tells us that homeowners who hold onto their properties throughout the year could see a natural increase in their homes’ market value.
It’s a reassuring sign for long-term investors and a helpful metric for potential sellers planning the right time to enter the market. This trend highlights the resilience of the local real estate market.
It also demonstrates that even with the anticipated year-end slowdown, property values in Louisville, have maintained a positive momentum.
New Year’s Market Outlook: Beyond the Initial Dip
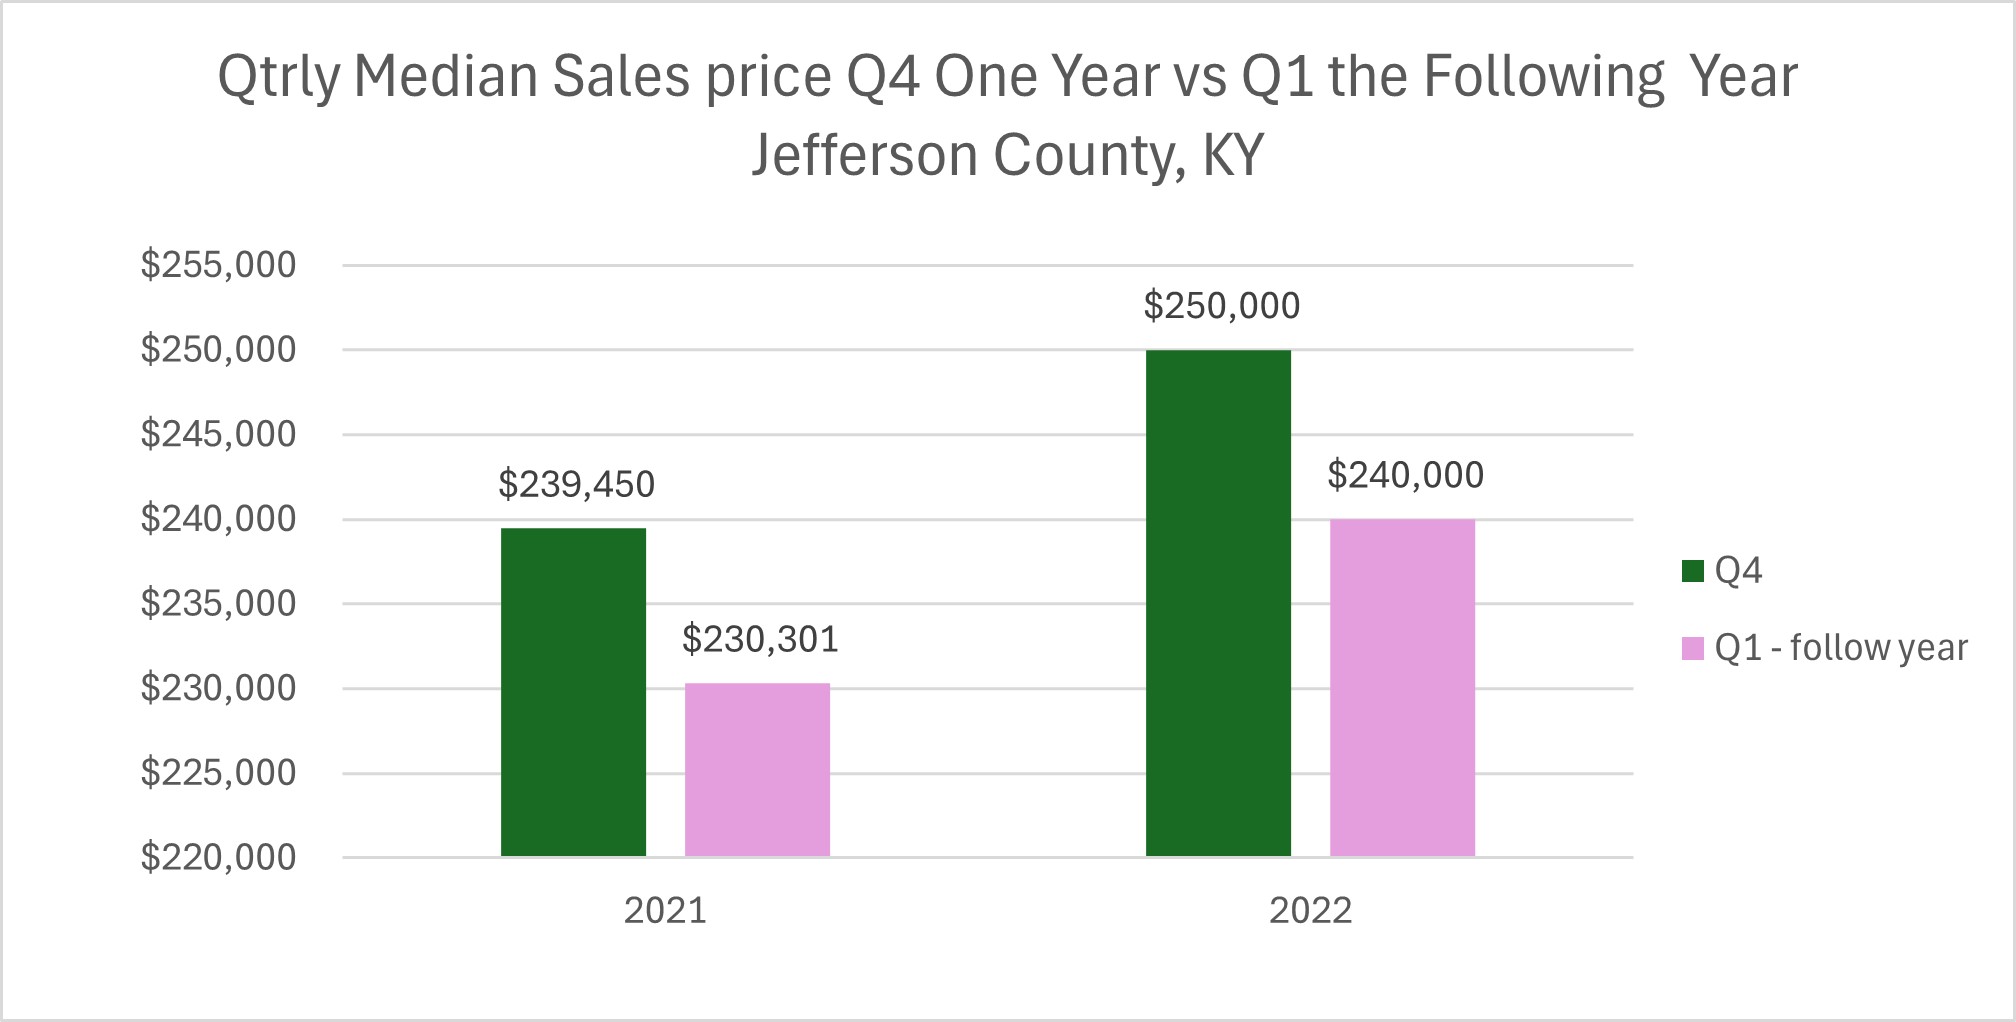
As we turn the calendar page each year, we see a recurring theme in the housing market. The beginning of the year often starts with a modest reset in home prices from their previous year-end highs.
This dip, however, is just a small chapter in an overall success story, as the trend line since 2021 is pointing upwards. This pattern means that while home values might momentarily soften as the New Year chimes in, they generally pick up steam as the months roll by, pushing the market value higher as the year progresses.
This trend is crucial for both buyers and sellers to keep in mind. If you’re considering selling your home and you’ve recently seen a property similar to yours sell at a peak price, it’s important to temper expectations.
A home appraisal report may well contain a valuation adjustment in line with the current market phase, particularly if there’s been a recent cooling. It’s a reminder to always be attuned to the rhythm of the market and to set your strategies accordingly.
Why Pay Attention to These Trends?
In the spirit of Stephen Covey’s second habit, “Begin with the End in Mind,” we turned our focus to the critical importance of market trends in the real estate landscape.
It’s not just a matter of peering through the data; it’s about understanding the narrative behind the numbers. This is where the essence of strategic foresight in real estate comes to life.
Paying close attention to the highs and lows of the market allows us to navigate with precision and purpose, ensuring that each step taken is a deliberate stride towards our ultimate objectives.
Maximizing Returns:
 Just as a captain charts a course by the stars, real estate market trends serve as our celestial guides, helping us navigate towards maximum profitability.
Recognizing the right time to list or purchase can make all the difference in the financial outcome of a real estate transaction. In Louisville, KY, for example, the upward trend in home prices, even amidst seasonal fluctuations, indicates a potential for sellers to maximize returns by timing the market judiciously.
Identifying Growth Opportunities:

By observing the shifts and preferences in the housing market, we identify not just current demands but forecast emerging trends that signal growth opportunities.
Understanding Market Shifts:
 The real estate market is as dynamic as the seasons, changing in response to a multitude of economic and societal factors.
Having a keen eye on these changes allows us to predict and prepare for the natural cycles of the market. It’s about reading the signs and knowing when to act. This understanding empowers us to make informed decisions that resonate with confidence and clarity, much like the principles Covey advocates.
Conclusion
In conclusion, the philosophy of ‘Begin with the End in Mind’ encourages us to thoughtfully consider how our current actions will shape our future outcomes. It’s not merely about staying informed but about being strategically equipped to make decisions that align with our ultimate aspirations.
Whether we’re buying, selling, providing guidance, or appraising, the insights we glean from a diligent analysis of market trends are priceless. They lay down a framework for informed action, grounded in deep understanding, which empowers us to navigate the real estate landscape with both foresight and the flexibility to adapt to ever-changing conditions.
By Conrad Meertins Jr
by Conrad Meertins | Jan 8, 2024 | Market Trends

The Power of Proactivity in Real Estate
Have you ever watched a chess master at work? Each move is made not just for the present but for the unfolding game. If she is going to win, one key will be mastering the habit of proactivity.
It’s little wonder that this habit is the first one mentioned of Stephen Covey’s Seven Habits of Highly Effective People. Will Real Estate professionals need this quality for 2024? Absolutely.
As Covey mentioned, exemplifying this habit means that we give ourselves space between stimulus and response and claim our control. In this article I’ll be reviewing activity from the first week of January with the goal of helping you to be proactive in the real estate game.
Current Market Pulse: A Snapshot of Early January 1/1/24 – 1/7/24

Is Our Market Bursting with Options?
As we stepped into January, we saw 1,222 homes for sale here in Louisville, KY. This could mean lots of choices for buyers. But proactive real estate professionals know there’s a need to look a bit closer.
Only a small slice of homes are actually getting offers (4.4%) and even fewer are being sold (2.8%). Could some homes be priced too high? Or is something else making buyers hesitate?
Something we can’t get away from is the fact that interest rates are between 6.62% and 7.20% for most home loans (depending on where you shop). Even though these rates have dipped a tiny bit, they’re still pretty high compared to the past, which could make buyers slow down and think twice as they contemplate that higher monthly payment.
Plus, let’s be real, moving when it’s cold and right after spending time off with family isn’t a fun idea for many people. That can definitely make for a slower market.
So what’s the real deal in Louisville, with our market (1222 active listings) in this chilly season?
We might have:
- a vibrant market with lots of options for buyers.
- a market that’s taking a breather with homes not selling as fast as expected. Or
- overpriced listings.
To really understand what’s happening, we’re going to take a closer look at the homes that did sell during the first seven days of January 2024 and check out the Cumulative Days on Market of homes that are still active.
What Week 1 -January 2024 Sales Reveal

Peering into the recent sales gives us a clearer picture of our winter market. In January’s first week, out of 1,222 homes up for grabs, 39 made it across the finish line. But how fast?
The pie chart lays it out: Over half of the homes sold (56.4%) in 30 days or less. This brisk movement indicates a segment of our market is priced just right—homes that buyers are snatching up quickly, likely because they hit that sweet spot of value and appeal.
Then there’s the 15.4% that closed in 31-60 days and another 15.4% in 61-90 days.
These homes took their time, but not too much time. It suggests a balanced approach—perhaps a minor price negotiation here or a little patience there paid off.
The smaller slices—10% selling in 91-120 days and a sliver at 2.6% beyond 120 days—tell us some stories took longer to tell.
These could be homes where initial expectations needed adjusting, whether due to price, property quirks, or just finding the right buyer who sees a diamond where others didn’t.
While this data strengthens our understanding of the Louisville market timings, a deeper layer awaits our attention – the interplay between the final Sale Price and the Original List Price (SP/OLP). This ratio sheds light about the art of pricing accurately from the onset.
January Sales with a focus on Sold Price/List Price Ratios

The Average Sold Price to Original List Price (SP/OLP) ratio tells us how the final sale price compares to the initial asking price.
0-30 Days: Homes in Louisville, KY that sold within a month almost met their asking price, with an SP/OLP of 99.22%, indicating they were likely priced right from the start.
31-60 Days: The drop to an SP/OLP of 94.92% for homes sold in one to two months hints at negotiations, perhaps due to ambitious initial pricing.
61-90 Days: A further dip in SP/OLP to 92.13% for sales in two to three months suggests either significant price drops or shifts in market trends.
Armed with stats like these you can advise clients on pricing their homes to sell within a desired timeframe, considering market dynamics.
But what about homes that are still on the market? How long have they been sitting, and what does their waiting time tell us?
To answer that question, let’s pivot to a Cumulative DOM analysis for active listings. In doing so, we’ll uncover another layer of the market’s story.
Average and Median Days on Market – for Homes that Have Not Sold


The canvas of our January market, with 1,222 active listings, is rich with detail when viewed through the lens of CDOM. The average CDOM across all MLS Areas is currently between 66 and 109 days.
The median CDOM, which ranges from 58 to 79 days across the areas, is a more balanced lens since the median is less affected by outliers. It indicates that over half of the homes have been listed for about two months or less. This is a more typical timeframe in a balanced market.
These insights are crucial for managing expectations on both ends—sellers can gauge how long it might take to sell their home, and buyers can spot opportunities for negotiating better prices on listings that have been on the market longer.
As we wrap up our review of January’s first week, remember that these statistics do more than just inform—they enable you to lead in the marketplace with authority and foresight.
But in order for that to happen you have to continue to pause after your exposure to data like this. Think about how it relates to a current or upcoming listing, and then take the appropriate response that indicates purposeful control – That’s being proactive!
Next week, we’ll delve into the second of Covey’s habits, ‘Begin with the End in Mind’, to further refine our strategic approach to real estate success.
Have a great week.
Conrad Meertins Jr.
by Conrad Meertins | Jan 1, 2024 | Valuation

In the world of home appraisals, the clash between emotional value and market reality often emerges, a theme vividly illustrated in a recent case I encountered.
About five months ago, a soft-spoken man sought my expertise for an unbiased appraisal of his father’s home. Caught in a $50,000 valuation disagreement with his brother, they turned to me to settle their differences.
This case unravels not just the complexities of property appraisal but also the emotional ties we associate with our homes. As we delve into this intriguing case study, we’ll explore how market data often challenges our expectations, teaching us valuable lessons in property valuation.

Background of the Property
Nestled in a neighborhood in Louisville, where property values are between $278,000 and $550,000, with a median sale price at $375,000, the subject property presented a unique appraisal challenge. This home, larger than most in its neighborhood at over 1800 square feet, had features both appealing and dated.
The basement, equipped with one kitchen, could be seen as a versatile addition, offering potential for rental income or extended family living. A second part of the property, transformed into a modern accessory unit, added a contemporary touch.
However, the main level told a different story. Despite being well-maintained, it was a time capsule of the 1970s, with its disco-era wallpaper and outdated fixtures. This blend of the old and the new, where the majority of the living space still echoed the past, demanded careful consideration in its valuation.

Appraisal Process and Challenges
As an appraiser, my process involved a meticulous valuation of the property’s attributes: its prime location, the large living area, and the modern updates on the second level.
However, the challenges were evident. The dated condition of the main level, representing 70% of the living space, significantly impacted the overall valuation.
Despite the modern renovations and unique features like an additional kitchen, the property’s true market value couldn’t solely hinge on its updates. It required a holistic view, considering both its strengths and weaknesses.
This comprehensive analysis led to a valuation of $325,000, a figure grounded in market realities yet distant from the clients’ expectations.

Client Reaction and Market Reality
When the appraisal valued the home at $325,000, the clients were in disbelief, struggling to reconcile this figure with their higher expectations of $400,000 to $500,000. Their emotional attachment to the home clouded their acceptance of the market-based valuation, particularly the impact of its outdated main living area.
Despite a detailed explanation during a follow-up meeting, their conviction in the home’s higher worth remained unshaken. Boldly, they listed the property for $405,000, but the market’s response was unequivocal.
After languishing for 100 days without interest, they had to reduce the price by over $30,000. But, there was still no interest. This stark contrast between expectation and reality highlighted a crucial lesson: emotional value doesn’t always align with market value.
Conclusion
In conclusion, the case of the “High Hopes Appraisal” serves as a powerful reminder of the complex interplay between emotional value and market reality in property valuation.
It underscores that while sentimental attachment can significantly inflate a homeowner’s valuation expectations, the true worth of a property is ultimately determined by the open market, influenced by current trends and objective data.
This case study highlights the importance of approaching property appraisals with an open mind, valuing the expertise of professionals, and understanding that market data often tells a story different from our personal narratives. It’s a testament to the fact that in real estate, numbers and market dynamics hold the final say, not our emotional connections to the property.
If you’re navigating the intricate process of property valuation and seeking an unbiased, market-informed perspective, reach out for professional appraisal services.
Let’s ensure your property decisions are grounded in reality and informed by expert insights. Remember, in the real estate market, it’s the hard data that ultimately shapes our success.
– Conrad Meertins, Jr.
by Conrad Meertins | Dec 26, 2023 | Market Trends

As we wrap up another year, I thought we could take a friendly stroll together through our very own real estate market here in Louisville, KY.
We’ll also take a cozy stop in Middletown to warm ourselves by the fireplace of hard data and heartening market insights.
It’s been a year of twists, turns, and a few surprises in the market. I’m sure you’ll find a few gems in this article.
Just to set the stage, I’ll peek at the bigger picture of Louisville, via Jefferson County’s overall performance comparing statistics from Dec. 2022 to Dec 2023, but I’ll keep it as light and digestible as a slice of your favorite pie.
Then, we’ll narrow our focus to the Middletown neighborhood. Why Middletown, you ask? Well, there has been a lot of activity in that area. For that analysis, we’ll examine the last 180 days of sales activity, so we can have a more current view of the market.
So, grab a seat, and let’s get down to business — the business of understanding our dynamic real estate market, that is. Trust me, it’s as intriguing as the latest neighborhood gossip, only this chat will arm you with insights to make your next move in the market a masterpiece.
Jefferson County Yearly Market Recap
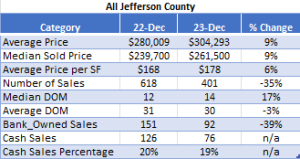
As we bid farewell to another year, let’s take a reflective look at how the Jefferson County (Louisville, KY) real estate market fared from December 2022 to December 2023.
Market Performance Highlights
Average and Median Sold Prices: We’ve witnessed a solid increase in property values with both average and median sold prices swelling by an upbeat 9%.
Price per Square Foot: The details matter, as we’ve seen with the average price per square foot stepping up by 6%. A partial contributor is the increase in home values.
Sales Dynamics
Number of Sales: Here’s where the plot thickens. The number of sales in Louisville, KY has taken a 35% dip. This has definitely caused alarm bells to ring. Is this a sign of a stabilizing market or perhaps a momentary dip in the ever-flowing river of real estate? Only 2024 will tell.
Days on Market (DOM): Properties have been taking a slight detour, with the median DOM increasing by 17%. It’s a modest nudge, suggesting that while homes are still moving, buyers are taking that extra moment to make their decisions.
Specific Trends
Bank-Owned Sales: Bank-owned sales have seen a significant drop of 39%. This could be a beacon of a strengthening economy or a shift in the bank’s approach to property sales.
Cash Sales: While the total number of cash sales has decreased, the percentage of cash transactions has held steady, indicating a consistent segment of the market that prefers the clink of coins over the rustle of banknotes.
Smaller Market Areas within Jefferson County
Diving into the local flavors of Jefferson County, let’s take a closer look at how specific areas have fared, comparing them to the broader strokes of the county canvas.
Valley Station – A Snapshot
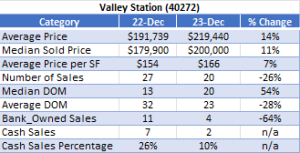
Average Price: The average price in Valley Station saw an impressive leap of 14%, outpacing the county’s overall growth.
Median DOM: Homes in Valley Station have been lingering a little longer on the market, with a notable 54% rise in the median DOM. It’s a curious trend that warrants a watchful eye.
St Matthews – The Upswing
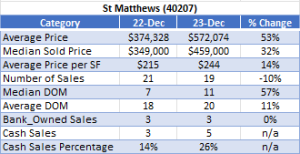
Average Price: St Matthews stands out with a whopping 53% surge in average prices, and a 32% increase in median prices. It’s a huge signal that this area is highly sought after, and properties here are being valued more than ever.
The Highlands – The Mixed Bag
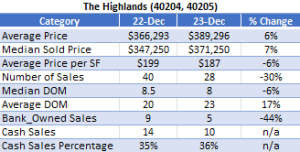
Average Price: The Highlands reported a 6% growth in average prices, a more tempered pace compared to its neighbors.
Sales and DOM: However, the number of sales has seen a drop of 30%, and the average DOM has experienced a rise. These statistics paint a picture of a more selective market.
Middletown – The Highlight of Today’s Show
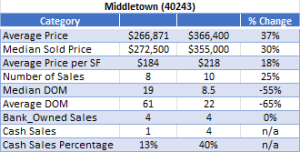
Middletown deserves a drumroll with a 37% hike in average prices and a 30% rise in median sold prices. But the real headline here is the dramatic drop in both median and average DOM—a clear sign that Middletown is where the action is. Properties here are not just selling; they’re selling fast.
Middletown Market Analysis – The Last 180 Days
As we focus our lenses closer on Middletown, I have a collection of graphs that give us a snapshot of the real estate dynamics over the past 180 days. From concessions to lot sizes, and days on the market, I’ve got the insights to share. Let’s dive in.
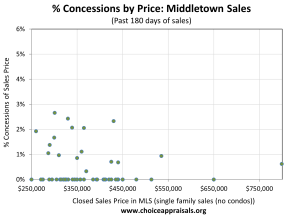
1. Concessions by Price: The trend here indicates that seller concessions are relatively rare and mostly low, even as sale prices vary. This suggests a strong seller’s market in Middletown.
2. Concessions Dollar Amount: Higher-priced homes seem to see larger concessions in absolute dollar terms, yet these remain a small fraction of the overall sale price.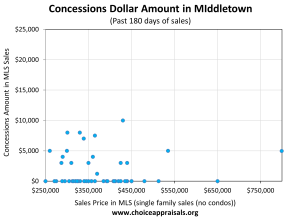
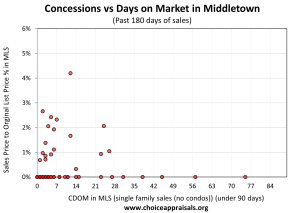
3. Concessions vs Days on Market: There does not seem to be much of an increase in concessions as the days on market increase.
4. Days on Market vs Final Price: The graph depicts a mixed market in Middletown, where homes with shorter days on market often sell close to the list price, yet there are notable concessions even among these quick sales, indicating nuanced buyer-seller negotiations.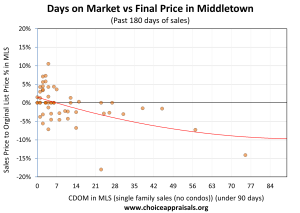
5. Price vs Lot Size: Larger lots tend to fetch higher prices, but there’s a wide range in sale prices across similar lot sizes, indicating that factors beyond just space are at play in pricing.
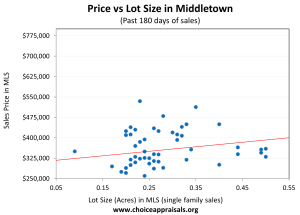
6. Price vs Square Footage: A clear correlation is seen between larger homes and higher sale prices, though the relationship is not strictly linear.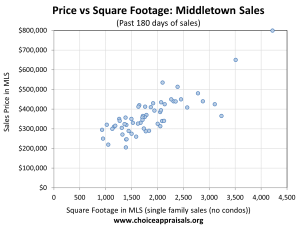
7. Price per Square Foot vs Bedroom Count: As expected, more bedrooms generally mean a higher price per square foot, yet there are outliers, suggesting that Middletown buyers value quality and features alongside size.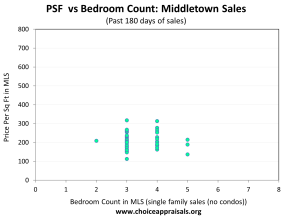
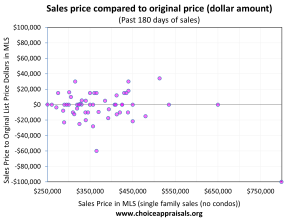
8. Sales Price Compared to Original Price (Dollar Amount): Most sales hover around the original list price. However, some are under the list .price, illustrating room for negotiation.
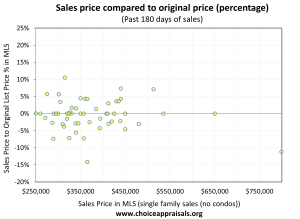
 9. Sales Price Compared to Original Price (Percentage): A similar trend as above, with sale prices closely aligned with list prices, affirming a market with a little room for price negotiation (but clearly not a lot).
Market Summary
In sum, Middletown’s real estate landscape over the past 180 days is characterized by strong seller confidence, evidenced by minimal concessions and sales prices that closely align with list prices Lot size and living space do influence sale prices, but they’re not the only factors.
Hopefully you’ll agree that this glimpse into Middletown not only sheds light on current trends but also arms you with the knowledge to better forecast, strategize, and navigate the local market with finesse.
A Cozy Wrap-Up
And just like that, our stroll through the real estate landscape of Jefferson County and the neighborhood of Middletown comes to a close. Hopefully, you’ve found a few gems that sparkled with possibility, as you discuss the market with your clients. If we compare today’s market to a fireplace, remember that these insights are the embers that keep your strategies warm and your decisions illuminated. If the figures and trends have piqued your interest and you or someone you know would benefit from a data-driven appraisal report, don’t hesitate to reach out.
Now, as we part ways on this virtual stroll, consider this an open invitation to connect and explore the realms of possibility together. Whether buying or selling, let’s make your next real estate endeavor not just a transaction, but a triumph.
by Conrad Meertins | Sep 11, 2023 | Uncategorized

The Tale of the “Larger” Home

Let me take you back to a property I once appraised. The MLS Listing advertised the home as a cozy 1,300 square feet. However, upon measurement, it was only a 1,000-square-foot dwelling. Sure, the market was on an upswing, and the list price fortunately equated to the market value, but what if the market had been stagnant or declining?
The discrepancy could have had serious repercussions. The potential buyers were under the illusion that they were getting a larger home. Realtors, let this be a cautionary tale. Accurate measurements are not just optional; they are critical. Let’s dive in.
The ANSI Standard: A New Measure of Accountability

As of 2022, appraisers are mandated to follow the ANSI® Z765-2021 standard, also known as the ANSI standard, for measuring homes. This standard covers everything from the gross living area to non-gross living areas like basements and additional structures. Fannie Mae’s selling guidelines are crystal clear: if your appraisals require interior and exterior inspections, you must adhere to this standard. Failure to do so renders the appraisal unacceptable.
Why is this important for realtors? Because it sets a standardized framework that you should also be following. If appraisers have to be this meticulous, why shouldn’t you? This leads me to my next point.
Taking Action: Measure Twice, List Once

If you find yourself in doubt, don’t hesitate to get your listing measured. I offer this service and am more than happy to assist. However, it’s not just about outsourcing; you can also take matters into your own hands. Measuring a home isn’t rocket science, but it does require careful attention to detail.
Here are some tools you might consider to ensure accurate measurements:
– Laser Distance Measurer: For quick and precise measurements.
– CubiCasa – a digital resource to create floor plans
– A Clipboard and Graph Paper: The old-fashioned but effective way to jot down measurements as you go.
Conclusion: The True Value of Accuracy
Remember, when a buyer or seller is looking at a home, they are envisioning a future, a lifestyle. Your listing sets the stage for that vision. An inaccurate listing not only disrupts that vision but could potentially lead to legal complications. In this ever-evolving industry, staying ahead means adapting to changes and upholding high standards of accuracy and integrity.
As the old adage goes, “Measure twice, cut once.” In our world, it’s more like, “Measure twice, list once.” May we all strive for this level of diligence in our practice.


